Cardano Price Prediction: Will ADA Price Soar to $0.5 Soon?
- Cardano price prediction delivers insights into the recent bullish recovery of the ADA token.
- ADA price recorded a year-to-date growth of 23.96%.
- Cardano’s price broke an ascending triangle reaching $0.3759
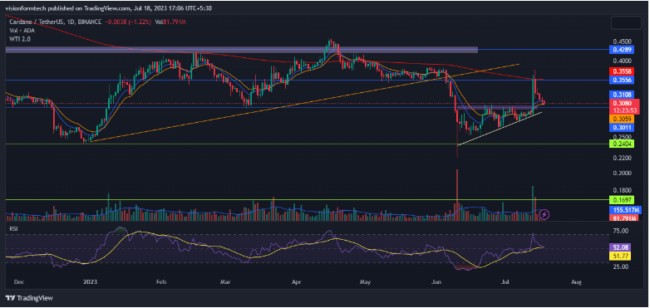
Cardano’s (ADA) price prediction highlights the correction phase of the ADA price, which started declining in April 2023. The market initiated the year 2023 with a bullish recovery of 68.43% to the resistance of $0.4289 from its swing low of $0.2404. It was followed by a pullback and a second attempt to break the resistance. However, the ADA token price couldn’t sustain above the resistance and lost control of the bears, which led to a decline to the support of $0.2404. It was succeeded by a 40% recovery to the current price level.
At the time of writing, the current market price of ADA tokens is $0.3053. The 24-hour trading volume surged 2%. The market is down 2.09% in the last 24 hours. The overall market cap of Cardano is $10,723,272,778.
Can ADA Sustain the Bullish Momentum?

Cardano’s (ADA) price prediction indicates that the price breached an important support trendline on June 5, 2023. This triggered panic selling, which led to a fall of 37.81% to the point where the ADA token briefly breached the important support of $0.2404. The bulls came to the rescue by aggressively buying the dip, propelling the ADA price to the resistance level of $0.3011.
Then, the market structure developed an ascending triangle pattern, which witnessed a Bullish breakout. The ADA token price surged 31%, peaking at $0.3795 following the breakout. The market is getting rejected at the resistance of $0.3556, which aligns with the 200 EMA.
Will Cardano (ADA) Take a Bounce at the Support?

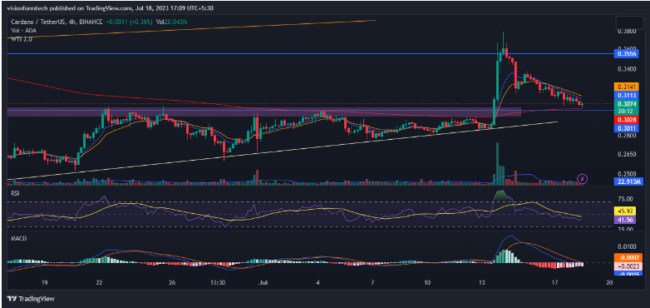
The 4-chart reveals that the bullish momentum has faded as the ADA crypto price has made a correction of 19.66%. The price is coming down to retest the support of $0.3011. Another noticeable observation is that the volume has diminished since the ADA token price started its correction.
The declining price and the volume are hinting at upcoming volatility, and investors are waiting for a healthy pullback before the price continues its uptrend. If the ADA crypto price breaks the support of $0.3011, expect a further decline that can drag the price all the way down to its important support. On the flip side, a retest at the support will increase the probability of the price moving toward the next resistance at $0.4289.
RSI: The RSI indicator is currently at 41.56. It represents bearish conditions where the price may continue to fall until RSI crosses above 50. An aggressive sell-off may happen only if RSI goes below 30.
MACD: MACD made a bearish crossover and the indicator has crossed below the 0 line. However, the MACD and the signal lines are moving adjacently. This means the market is consolidating with a lack of momentum.
200 EMA: On the 4-hour chart, the price is trading above the 200 EMA. This is a bullish sign and an indication that the buyers are in control. The 200 EMA acts as a dynamic support, and the prices may continue to move up until the price breaks below the indicator.
Conclusion:
Cardano’s (ADA) price prediction highlights the correction phase of the ADA price, which started declining in April 2023. However, the recent bullish recovery has revived hopes for the bulls. The price has been cooling down after the recent volatile move. At present, investors can wait for a retest to be represented by any reversal candlestick pattern such as a hammer or a pinbar in order to consider buying. The present situation can be best handled using a good risk management strategy.
Technical Levels
- The nearest support level: $0.3011
- The nearest resistance level: $0.3556
Disclaimer:
The views and opinions stated by the author, or any people named in this article, are for informational purposes only and do not establish financial, investment, or other advice. Investing in or trading crypto assets comes with a risk of financial loss.
