COCA – COLA HBC ( CCH ) STOCK ANALYSIS: WAITING FOR A MUCH NEEDED BREAKOUT
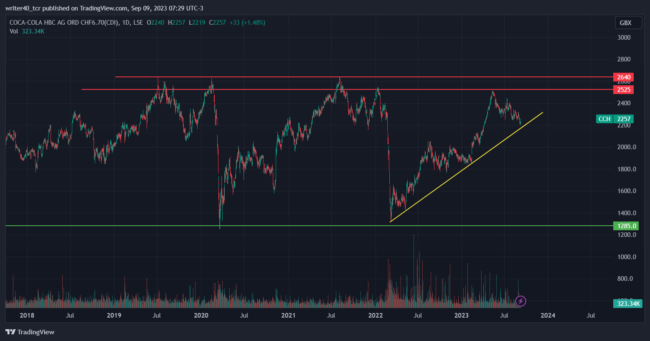
- COCA – COLA AWAITING FOR A RANGE BREAKOUT SINCE 4 YEARS.
- COCA – COLA HAS GIVEN 17.25 % IN A YEAR TILL DATE AND DOWN BY 10% FROM YEAR HIGHS.
- NO SIGNIFICANT GAIN IN EPS AND NET INCOME SINCE 5 YEARS .
CURRENT MARKET CAPITAL OF COCA – COLA HBC – $ 8.31 B
CURRENT MARKET PRICE OF COCA- COLA HBC – $ 2257
Since 2018 the company has not provided a significant improvement in revenue where the annual revenue generated by the company was increased slightly on an average of 7% till 2019 , after that in the corona phase the revenue was hit massively as the revenue declined by over 11% .
Net income of the company was flat to negative for 6 years along with the EPS which is also in a flat range where no significant improvement is visible and net debt of the company is rising after 2018 which cost the share price as it is also trading in the same range since 2018.
As per the daily time frame the price is in uptrend with the help of rising trendline support and currently trading very close to it , the resistance for daily time frame is standing near the levels $ 2525 and $ 2640 and the support near $ 1285.
Coca-cola is facing a hard rejection from the levels near $2655 as the stock price has fallen badly 2 times for about 49% and 45% respectively within a short dimension and on the weekly chart the price formed a very massive bearish candle.

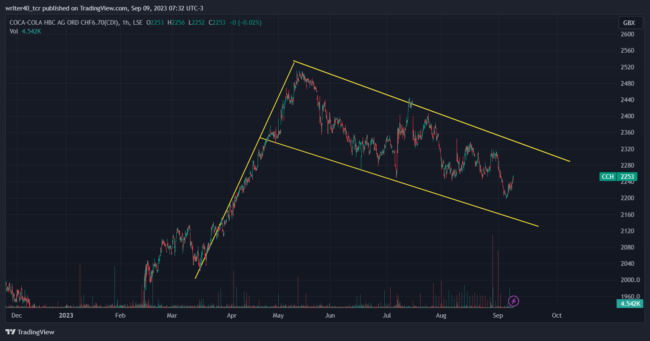
On 1 hour chart the price is forming a flag and pole pattern as the price is declining in a slope and the resistance level for the flag pattern is near $ 2318 which is also a previous swing high level, the support of this pattern is near to $2140 which is colliding with the horizontal support level.
Flag and pole pattern is considered to be a bullish pattern and if the price breaks the flag on upside then we can see a goof up move as the market is expecting a good result this financial year and the win probability of this pattern will increase significantly with the outcome.
The price is down by 1.48 % in a week and 3.05 % in a month which indicates it is in a bearish trend.
CONCLUSION :-
As the price is in long term consolidation because of the poor outcome of the company and now the company is expecting to improve its financial tally so we can expect a breakout of the flag and pole pattern which can lead the stock towards all time high and also the price can try to break that level too.
TECHNICAL LEVELS :-
RESISTANCE – $ 2310 AND $2400
SUPPORT – $ 2198 AND $2130
DISCLAIMER-
The views and opinions stated by the author, or any people named in this article, are for informational purposes only and do not establish financial, investment, or other advice. Investing in or trading crypto assets comes with a risk of financial loss.

