IMI Plc (LON: IMI): Will IMI Stock Price Reach 1670 in 2023?


- IMI Plc stock price reached near its demand zone.
- IMI stock is currently trading in a downtrend that started on July 27 2023.
- The IMI stock price is getting rejected from the 100-day EMAl.
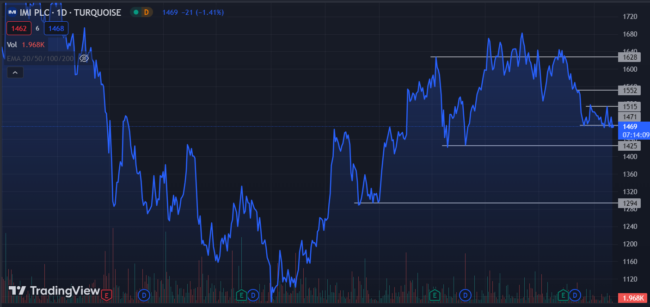
The IMI Plc (LON: IMI) stock price is trading at 1470 and reached near the previous major demand zone ranging from 1425 to 1471. Buyers are probably waiting for the right moment to enter, and the first target rally would end once it reaches the 1515 level.
The stock price is moving in a short term downtrend that started on July 27 2023. The price dropped nearly -11.53% during the last two months session but now the price is nearing the demand zone.
The stock is trading below the 100-day EMA at 1525, Sellers are trying their strength to break the previous support level at 1425 and push the stock price further down.

Will IMI Plc Continue To Trade In Uptrend?
According to the chart above, IMIL will continue to trade in an uptrend until it reaches the 1850 level. To reach the major target, the price has to go through some minor supply levels at 1515, 1552 and 1628. At these levels, the sellers are a bit more active because of the selling pressure, but if the stock gains some bullish momentum, then the probability of achieving the target becomes high.
From the chart data starting on September 26, 2022, it’s evident that IMI Plc (LON: IMI) stock has maintained a consistent uptrend. Over this period, buyers have executed three notable upward moves. Given this historical behavior and the presence of a prior demand zone, there is a reasonable expectation that buyers may re-enter the market to drive prices higher once more. This suggests a significant level of buying interest in the stock.
Technical Analysis Of IMI Stock Price

The current technical analysis of IMI Plc (LON: IMI) stock indicates the emergence of a short-term downtrend, as evidenced by the recent alignment of various exponential moving averages (EMAs), including the 20-day, 50-day, 100-day, and 200-day EMAs, which have converged just above the current trading price of 1470. However, it’s important to note that this alignment has occurred relatively recently, suggesting that the strength of this downtrend may be limited.
In terms of the MACD indicator, it reflects a bearish sentiment at the moment. The MACD line, with an average value of -15.55, currently positions itself above the signal line at -17.96, indicating that bearish volume currently outweighs bullish volume. This implies a more active presence of sellers in the market presently. Moreover, the close proximity of the MACD line and the signal line suggests that potential buyers might need to exercise patience before considering entry into the market.
On the other hand, the relative strength index (RSI) shows signs of bullish strength divergence. The RSI line, standing at 41.81, surpasses its yellow signal line at 40.40. In comparison to the price chart, this indicator demonstrates a greater degree of strength in bullish price movements as opposed to bearish ones. This observation raises the likelihood of a demand zone being established in the near future.
How IMI PLC Trends On Supertrend
Technical Levels
- Resistance Levels: 1525 and 1670
- Support Levels: 1471 and 1425
Disclaimer
The views and opinions stated by the author, or any people named in this article are for informational purposes only. They do not establish financial, investment and any other type of advice. Investing in or trading in stocks comes with the risk of financial loss.


Recent Posts
BlockDAG And Best Wallet Presale Participants Receive Free Skyren DAO Airdrop
Token airdrops have historically introduced investors to new blockchain projects. However, many distributions fail to…
Skyren DAO Token Surge Event: Remittix And Lightchain AI Communities First To Benefit
Airdrops have traditionally been used to introduce new investors to blockchain projects, but their effectiveness…
Bitcoin ETF Approval? Old News. Here’s Why Skyren DAO Could Outperform BTC 10-fold
The approval of Bitcoin ETFs was one of the most anticipated events in crypto history,…
Qubetics And Rexas Finance Holders: Claim Your 500 Free SKYRN Tokens Now
The blockchain space continues to evolve, with projects pushing security, scalability, and user engagement to…
Cardano Skyren DAO And Remmitix Potential Highlighted As Market Optimism Rises
As the cryptocurrency market recovers from recent volatility, several projects emerge as strong contenders for…
Cardano And Litecoin Ready To Rally: Analysts Predict 10x Gains For This Newcomer
The cryptocurrency market is showing strong bullish signals, with many altcoins poised for significant gains.…