
: is the price ready for a breakout")
International Consolidated Airlines (IAG): is the price ready for a breakout
- IAG stock price is trading near its 52-week high level.
- IAS stock price is down by 1.22% in a week and 6.42% in a month but surged by 43.11% in a year.
- IAS’s revenue jumped over 171% in 2022, net income turned positive after two negative years.
Market capital of Internation Consolidated Airline: 7.523 Billion GBP
Current Market Price of International Consolidated Airline: 153.70 GBP
International Consolidated Airline stock price has risen by 0.65 GBP (0.42%) in its previous trading session on 15 September. The short-term trend of the stock is downward as the price has declined over 1.22% in a week and 6.42% in a month which indicates that the price is facing some selling pressure from the above levels.
Although the price of the stock has surged over 43.11% in a year which indicates that the long-term momentum of the stock is bullish. The price is trying to breach the resistance level but it is failing to do so. The price has shown some volume surprise on the hourly time frame at support levels.
The company’s revenue saw a huge jump in 2022 as the revenue posted by the company was 171% more than the previous year. The net income turned positive as the company posted a net loss of 2.52 Billion GBP but in 2022 the company posted a net profit of 353 million GBP which is a good jump.
The net debt of the company is standing at 9.21 Billion GBP in 2022 which has risen from 1.11 Billion GBP in 2018, considered as a huge growth in number. Although the company has significantly raised its cash and receivables, as the number stands at 10.85 Billion GBP which is more than the NEt debt.
Technical Analysis of IAG:
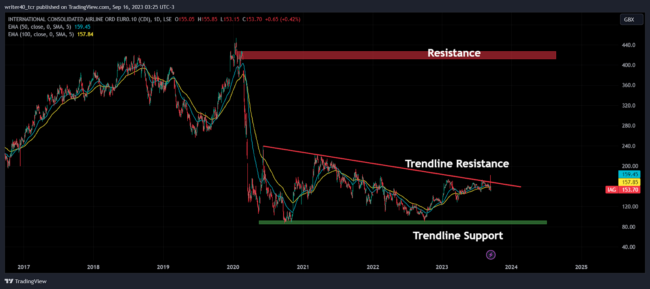
The price has formed a descending triangle pattern on the daily chart where the support is present near 89-90 GBP. The trendline resistance is currently placed at 168 GBP which is very close to the price. The slope of the EMA is flat to upward which indicates that the bulls are slightly overpowering the bears.
The major resistance level is visible near 410 GBP level, as the market has sharply declined from that level during the coronavirus phase. The price is trading slightly below the EMA levels which is a bearish sign but momentum is still in favour of bulls. The fundamentals are performing now it is the right time for the price to perform.
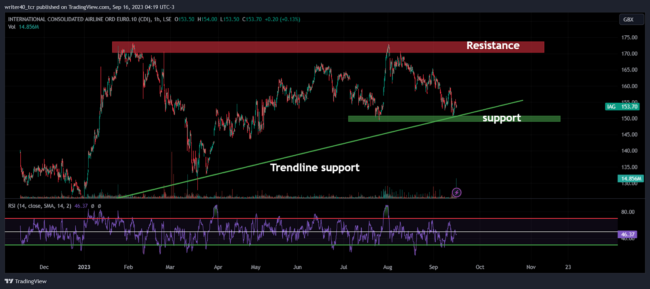
The price on the hourly chart has formed an ascending triangle pattern which is just opposite to the daily time frame. The resistance level is present near 170-173 GBP which is pushing the price on the downside. The price has formed a support near the level of 149-150 GBP which is lifting the price up. The price has also been supported by the trendline support as drawn in the chart.
Conclusion
As the price is looking good to cross the resistance level but on an hourly time frame the chart is losing its strength which is a matter of concern for the bulls. RSI is also falling below the 50 on the hourly chart frame which supports the above statement. Although on a daily time frame price has shown an excellent recovery from the downside.
If the price crosses and sustains above the level of 175 GBP then it can unlock the upper level of 220 GBP and 400 GBP for the future.
Technical Level
- Resistance- 170 and 174 GBP
- Support- 147 and 90 GBP
Disclaimer
The analysis is done for providing information through technical analysis and no investment suggestions are given in the article to be made by investors. The coins are unpredictable so investors should have proper knowledge. Cryptocurrencies are highly volatile and risky. Investment should be made with proper technical analysis.