Marston’s Plc Stock Analysis: Will It Break the Resistance Level
- Marston’s Plc is a British company which operates pubs and hotels.
- John Marston founded this company in 1834. Its MARS stock is listed on the London Stock Exchange (LSE).
- Let’s analyze the MARS stock price movement to assess whether you should invest in this share or not.
The MARS stock overall is in a sideways position. This stock is not good for a long-term investment. It has been trading between the range of support level and the resistance level. The chances of breakout are very low as the stock has been in a sideways position from the beginning.
Investors should wait for some breakout and then think about whether to invest or not. The breakout can result in a downfall or in an upward movement of the MARS stock.
Moreover, we will analyze the stock with the help of charts to assess how this share may perform in the future.
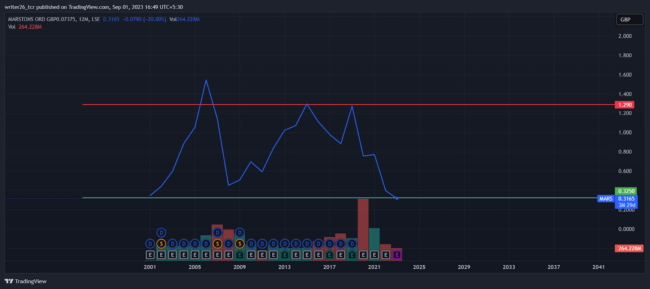
Technical Analysis of the MARS Stock (Yearly)

In the yearly time frame, we can clearly see that the stock is in between the support level and the resistance level. The stock is not good for a long-term investment. The investors should wait for a breakout or should invest their money in the companies performing well. The company from the beginning is in a sideways position and the chances of high returns will not be high. The stock can be bought at the support level and can be sold on the resistance level. It will give small but sure returns.
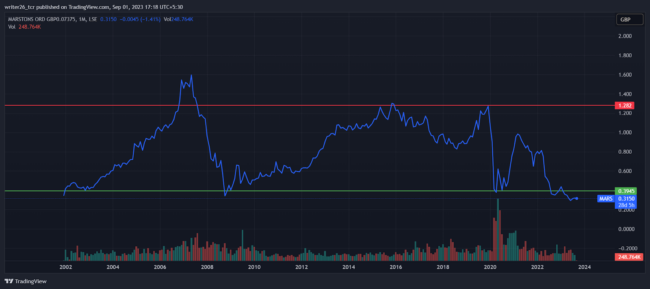
Technical Analysis of the MARS Stock (Monthly)

In the monthly time frame, the stock has given a breakout. It is moving in a downward direction. The stock also broke the support level. The stock is not good for investment as it went to an all-time low value since it got listed. The stock may continue a downward movement as it has given the breakout in the downward direction.
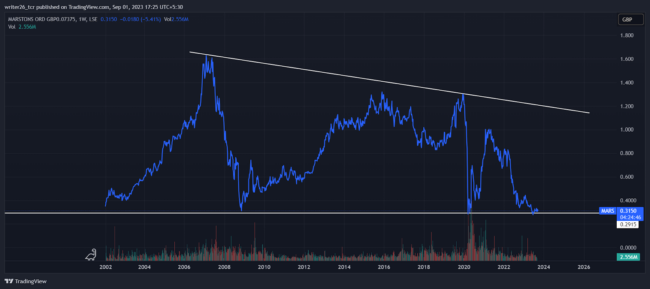
Technical Analysis of the MARS Stock (Weekly)

In the weekly time frame, the stock is in a sideways position. However, near the current market price, it is in a downtrend. The stock is not suitable for investment as it ranges between the support and resistance levels. The chances of the stock moving up are there as it can take support from the support level and initiate an upward movement.
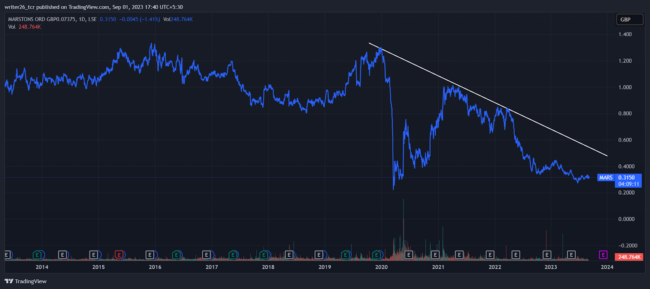
Technical Analysis of the MARS Stock (Daily)

In the daily time frame, the stock is going downward. So, it is an opportunity for short sellers, but not for a long-term investment. The stock overall is in a sideways position, but it is a downtrend near the current price. The stock is in a sideways position in a weekly, monthly, and yearly time frame. However, it is in a downtrend in a daily time frame.
Summary
All in all, the stock is in a sideways position in the yearly, monthly, and weekly time frames. It is not very much a good stock to invest in for positional or swing trading. However, it is in a downtrend in the daily time frame. So for traders, MARS can be a good stock for short selling. It may offer appealing returns on investment to the traders in intraday sessions.
Technical Levels
Resistance Level: 1.004 GBP and 0.848 GBP (Daily Time Frame)
Support Level: 0.3015 GBP and 0.654 GBP (Daily Time Frame)
Disclaimer
The analysis is done to provide information through technical analysis and no investment suggestions are given in the article.
