Render Network (RNDR) Analysis and Prediction
The Render Network (RNDR) links creators who need more processing power to render their scenes to suppliers who are paid in RNDR Tokens for their GPU resources. It makes the transactional workflow of rendering and streaming 3D environments, models, and objects for end users simpler by enabling complex GPU-based render jobs to be distributed and processed across a peer-to-peer (P2P) network.
The distributed RNDR Network is a peer-to-peer (P2P) graphics processing unit (GPU) computer network, and its RNDR Token is an ERC-20-compliant utility token used to pay for animation, motion graphics, and visual effects (VFX) rendering.
History
Jules Urbach, CEO of OTOY Inc., a Los Angeles-based tech business that specializes in GPU-based software solutions, first had the idea for the RNDR Network. The organization was established with the intention of utilizing blockchain technology to expand the use of GPUs globally for uses other than proof of work (PoW) for other blockchains.
In 2017, the initial coin offering (ICO) ran from October 6 to October 12. 4,650,922 RNDR Tokens were sold in total throughout that time at a cost of $0.25 each. The team predicted in March 2018 that there will be 536,870,912 issued tokens overall in the ecosystem. The contract migration process started with a 1:1 migration ratio between old and new contracts.
The current price of Render Token is US$1.93 and its 24-hour trading volume is $33.65 M. In the past 24 hours, RNDR has increased by 2.74%. The current distance from its seven-day high of $2.24 and its seven-day low of $1.84 is -13.88% and 4.54%, respectively. RNDR has a maximum supply of 536.87 million RNDR and a 369.61 million RNDR circulating supply.
The current price of Render Token is $ 1.931044, with a 24-hour trading volume of $ 108.31M, a market capitalization of $ 713.74M, and a market dominance of 0.06%. In the previous 24 hours, the price of RNDR rose by 2.91%.
Render Token’s greatest price was recorded on November 21, 2021, when it traded at an all-time high of $8.77, and its lowest price was noted on September 22, 2020, when it traded at an all-time low of $0.000115. Since its ATH, the price dropped to $ 0.277999 (cycle low). Since the last cycle low, the greatest RNDR price was $2.89 (cycle high). The current Fear & Greed Index reading is 56 (Greed), while the mood regarding the price projection of the Render Token is neutral.
RNDR Analysis
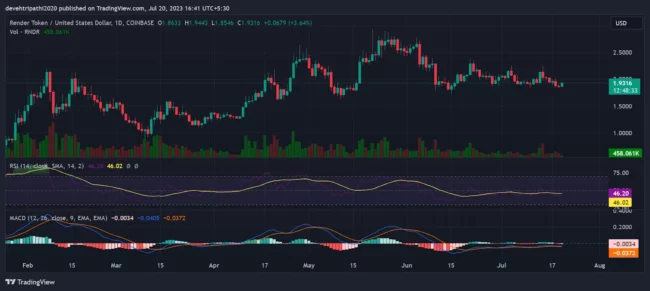
Render Token presently has a total supply in circulation of 369,614,008 and a market capitalization of $717,579,816. The cost of Render Token has gone up by 3.60% in the last day. Over the last seven days, Render Token has had trouble acquiring traction, falling 1.98%. If you are considering purchasing Render Token, now may be a good time to invest as RNDR is displaying negative indicators this week.
RNDR’s price declined by 3.27% during the past 30 days, devaluing it from its previous value of $2.01 to $0.06568. Render Token is currently in a dip as a result of the present downward trend. The price of a Render Token has increased by 7.53% during the last 90 days, going from $1.81 to $0.136054.
On Daily Chart
- The Moving Averages Convergence Divergence (MACD) indicator for Rand Mining Limited (RND) is 0.01, indicating that Rand Mining Limited is a Sell.
- With a 20-Day Exponential Moving Average of 1.22 and a share price of AU$1.23 for Rand Mining Limited (RND), it is recommended that you buy.
- With a 50-day exponential moving average of 1.24 and a share price of AU$1.23 for Rand Mining Limited (RND), the stock is considered to be a Sell.

On Weekly Chart
- The Moving Averages Convergence Divergence (MACD) indicator for Rand Mining Limited (RND) is -0.04, indicating that Rand Mining Limited is a Buy.
- With a 20-Day Exponential Moving Average of 1.27 and a share price of AU$1.23 for Rand Mining Limited (RND), it is considered a Sell.
- With a 50-day exponential moving average of 1.32 and a share price of AU$1.23 for Rand Mining Limited (RND), it is considered a Sell.

Indicators
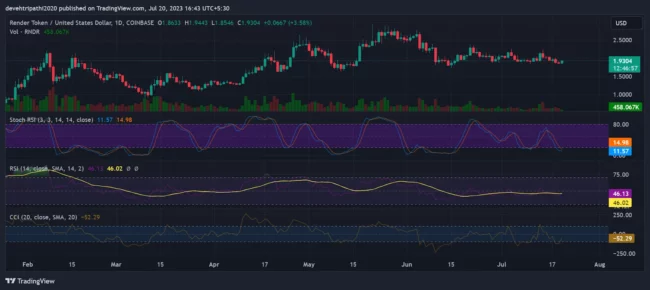
- The Relative Strength Index (RSI) for Rand Mining Limited (RND) is 44.63, indicating a Neutral trend.
- The Trend Strength Indicator (ADX) for Rand Mining Limited (RND) is 37.54, indicating a Neutral trend.
- The Commodity Channel Index (CCI) for Rand Mining Limited (RND) is -86.71, producing a Neutral signal.
- The Price Rate of Change (ROC) for Rand Mining Limited (RND) is -7.52, indicating a Sell.
- With a 10-Day exponential moving average of 1.24 and a share price of AU$1.23 for Rand Mining Limited (RND), the stock is considered to be a Sell.
- With a Sell rating and a 100-day exponential moving average of 1.38 and a share price of AU$1.23 for Rand Mining Limited (RND), respectively.
Prediction
By July 25, 2023, the price of the RNDR Token is expected to fall by -7.32% and hit $ 1.758562, according to our most recent price projection. Our technical indicators indicate that the current mood is Neutral, while the Fear & Greed Index reading is 56 (Greed). Over the past 30 days, Render Token has experienced 4.51% price volatility with 14/30 (47%) green days. It’s an excellent moment to acquire Render Token right now based on our Render Token forecast.
Price forecast for Render Tokens for 2025
Currently, the forecast for the price of a Render Token in 2025 ranges from $ 3.71 on the low end to $ 14.99 on the high end. If RNDR hits the higher price target, Render Token might increase in value by 676.22% by 2025 in comparison to its current pricing.
Price Forecast for Render Tokens in 2030
Currently, the projected price range for Render Tokens in 2030 is from $ 10.84 on the low end to $ 13.72 on the high end. If Render Token hits the higher price target by 2030, it might increase in value from its current price by 610.81%.
