

Bitcoin Price Analysis: Will BTC Sustain the Breakout?
- Bitcoin (BTC) is currently trading at $30753 with a rise of 9.04% in 24 hours.
- Bitcoin (BTC)’s live market cap is $596,866,603,257.
- Bitcoin (BTC)’s 24-hour volume is $24.6B which rise by 29.46% in 24 hours.
Introduction
A person or group of persons using the alias Satoshi Nakamoto developed Bitcoin, a decentralized digital money in 2009. Since it is the first and most well-known cryptocurrency, there is no need for a central authority or governing body.
The foundation of Bitcoin is based on blockchain, a distributed ledger that keeps track of all transactions across a network of computers. Transactions are made transparent, secure, and immutable because of this technology. The network users known as “miners” utilize specialized technology to solve challenging mathematical problems to validate Bitcoin transactions. The restricted supply of Bitcoin is one of its distinguishing qualities. Bitcoin is a rare asset since there will only ever be 21 million of them. Because of this scarcity and rising demand, Bitcoin’s price rose over time, making it an appealing investment for some.
Trend Analysis
In recent years, there have been major price changes for Bitcoin. When looking at Bitcoin’s long-term trend, it has seen a huge price increase since its introduction. Bitcoin has had numerous boom and bust cycles over the years, which are characterized by periods of fast price growth followed by substantial corrections. The long-term trend has largely been upward. In the past nine days, the price of Bitcoin (BTC) has climbed by 27.25%, demonstrating that it is now outperforming. In just a year and a half, Bitcoin (BTC) climbed as high as $69,000. It has decreased since by -76.90% since then.
Bitcoin (BTC) Price Analysis
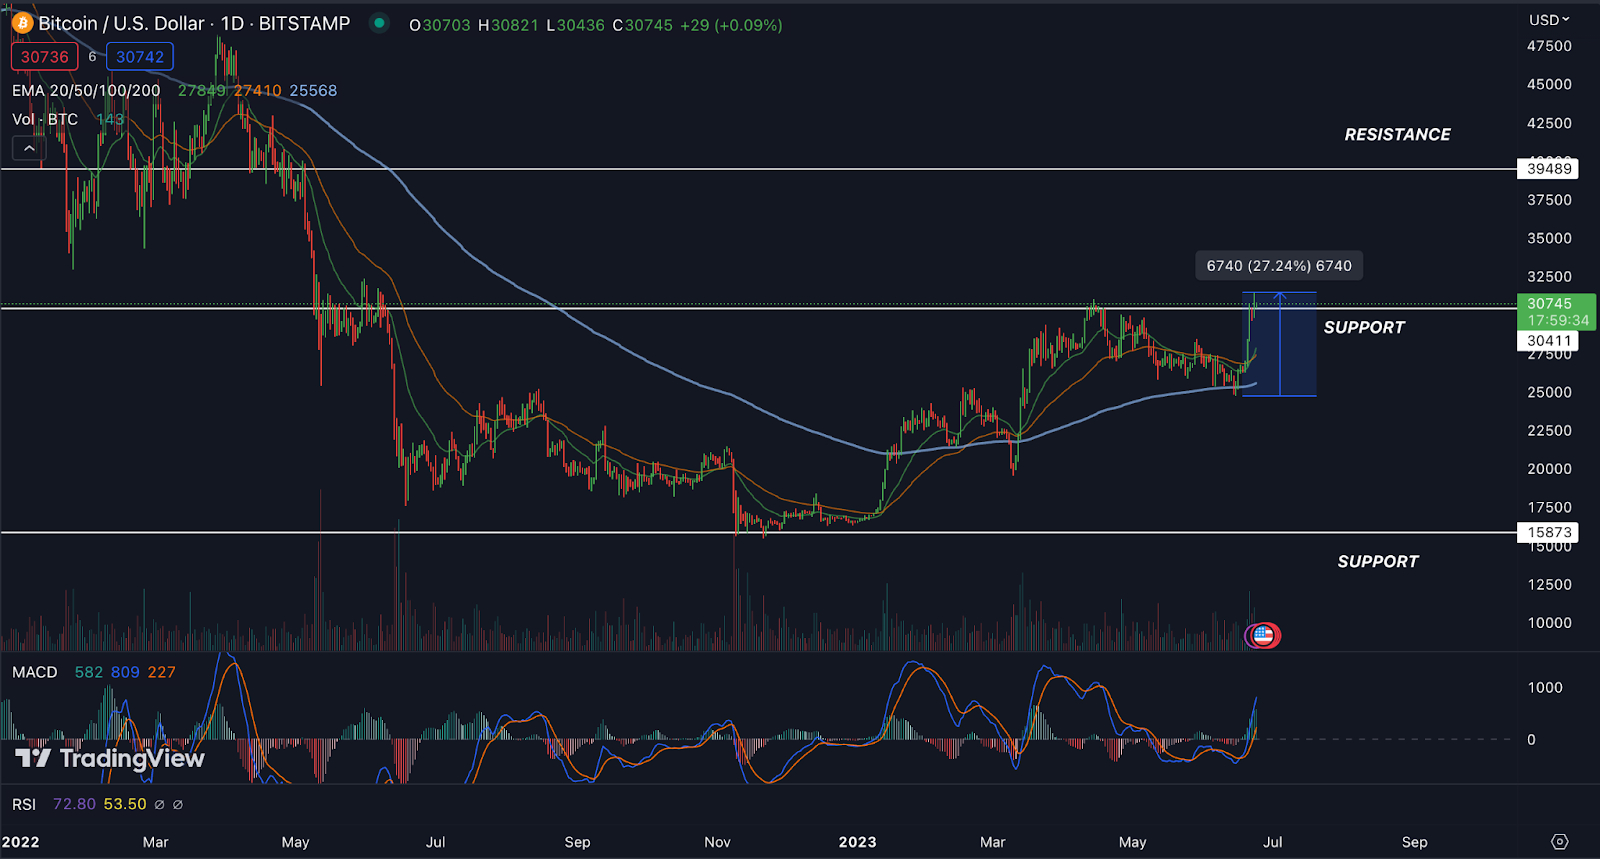
EMA: The price of Bitcoin (BTC) is currently trading above both the 20-day and 50-day exponential moving averages in the daily time frame, which is a bullish indicator. Bitcoin (BTC) is the focus of buy-side investor sentiment and bullish momentum.
MACD: The MACD line for Bitcoin in the daily timeframe is currently above the signal line as per the recent data. The signal line is at 210 and the MACD line is at 803, both of which are above the zero line. This bullish crossover implies that short-term buying pressure may outweigh selling pressure. It suggests that Bitcoin may be moving in an upward trend.
Volume Analysis: The Bitcoin (BTC) 24-hour trading volume is $24.6 Billion, with an increase of 29.46%, indicating an increase in market activity in the current state.
Technical Levels
Support – The current support level of Bitcoin (BTC) is at $30411.
Resistance -The current resistance level of the Bitcoin (BTC) is $39489.
Conclusion
In conclusion, Bitcoin (BTC) currently exhibits positive indications according to the study of the MACD, and EMA in the daily period. The MACD suggests buying pressure, and the EMA is below the price, 20-50 has given the crossover indicating a positive move. Before making any investment decisions, traders and investors should undertake extra research, take other considerations into account, and employ risk management techniques.
Disclaimer
The views and opinions of the author, or anyone named in this article, are for informational purposes only. They do not offer financial, investment, or other advice. Investing or trading crypto assets involves the risk of financial loss