

Accenture PLC: Is ACN Stock Price Ready To Surge At $345?
- ACN Stock Price Maintains a steady trajectory to the upside
- ACN Stock delivered Year-To-Day Growth of 14.63%
ACN Stock Price began a steady ascent in March and delivered a growth of almost 25% since. Accenture PLC, INC. closed the week at $308.58. with a surge of 0.08% over the previous day.
In an interview with Bloomberg, Julie Sweet, CEO of Accenture shared plans to invest around $3 Billion in Data and Artificial Intelligence. The key agenda behind this is to double the staff for AI and enhance the company’s capabilities to meet the increasing demand for Advanced Analytics and AI.
ACN Stock Price: Retest of Inverse Head & Shoulders

Source: ACN by TradingView
The Daily chart establishes a bullish outlook or ACN Stock Price. The market started ascending in March after getting a reversal from a key support level of $250.87. The Bullish trend surged the prices by almost 30% to the resistance level of $322.63 since March.
ACN Stock Price broke an inverse head and shoulders pattern on 26th May and witnessed a spike of almost 10% before retracing down at $296 for a retest. The Prices have recovered 4.5% and look to be moving in a trajectory aimed at the target of the inverse head & shoulders pattern, which is around $344.
Potential Bull-Flag: Technical Indications
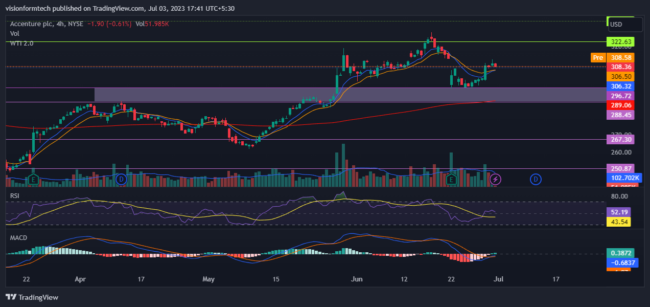
Source: ACN by TradingView: https://www.tradingview.com/x/Ehu4dkz0/
A closer look at the 4H timeframe unveils the bullish sentiments of the market as ACN Stock creates higher highs. The prices are trading above the 9.16 and 200 EMA which represents an uptrend. The immediate resistance is a significant one because the prices saw a fall of almost 22% from here back in 2022.
ACN Stock price depends on the ability of the bulls to break above this level which may welcome a surge of 7% to its next hurdle at $344. Technical Indicators suggest that a bounce from the pullback may be in progress and there is a high probability of bullish to sideways move in the short-term.
RSI
The RSI indicator is currently at 52.15. It means the market may move sideways in the short term
MACD
The MACD indicator is attempting to make a bullish crossover. However, the indicator is below 0 And Bullish momentum may increase if the indicator moves above it.
200 EMA
As observed, on the 4hr, the price is trading above the 200 EMA(exponential moving average) which acts as a significant support. This is a clear indication of an uptrend where the buyers are in control and for a trend reversal, the price must break and trade below the 200 EMA.
Summary
ACN Stock Price began a steady ascent in March and delivered a growth of almost 25% since. The market appears to be bullish and the buyers will continue to buy as long as the market stays above 200 EMA. The short term may witness a bullish to sideways condition. A break above resistance will induce momentum and prices may start to fly once again. Investors are advised to navigate this volatility with proper risk management.
Technical levels
Support Levels: $296 – Support 1
$298 – Support 2
Current Price: $308.58
Resistance Levels: $322.63 – Resistance 1
$345.85 – Resistance 2
Disclaimer
In this article, the views and opinions stated by the author, or any people named are for informational purposes only, and they don’t establish investment, financial, or any other advice. Trading or investing in cryptocurrency or the stock market comes with a risk of financial loss.