
 Coin Technical Analysis: Explaining Price Trends")
Alchemy (ACH) Coin Technical Analysis: Explaining Price Trends
- Alchemy (ACH) is trading at $0.01891823 with a dip of -4.96% in 24 hours.
- The live market cap of Alchemy (ACH) is $93588588.
- Alchemy (ACH) faced a rise of -17.39% in the last seven days.
Trend Analysis
By analyzing previous price data, Alchemy (ACH) is in a bearish trend. The price is down by -17.39% in the last seven days, and Alchemy (ACH) is not performing well. The indicator is also giving negative signals. The peak price of Alchemy (ACH) was $0.198666 about two years ago, and from there, it fell to about -90.14%. The adverse performance of the coin shook the trust of the market and the buyers. That is why there is no significant buying involved in it.
Alchemy (ACH) Technical Analysis
EMA: Alchemy (ACH) Price is trading below the 200-day EMA and 50-day EMA on the daily time frame, which is a negative sign. Investors’ sentiments regarding Alchemy are pessimistic and are on the selling side.
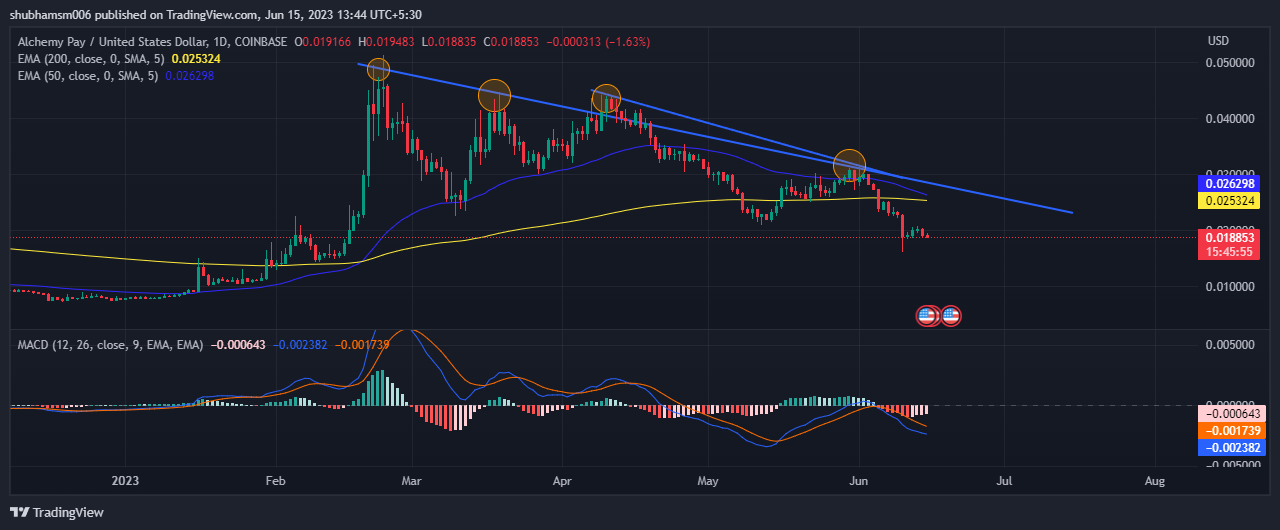
MACD: The technical indicator moving average convergence divergence is also negative and gives a bearish signal. The MACD line at -0.002382 and the signal line at -0.001739 are below the zero line, suggesting the MACD is in negative territory and gives bearish signals.
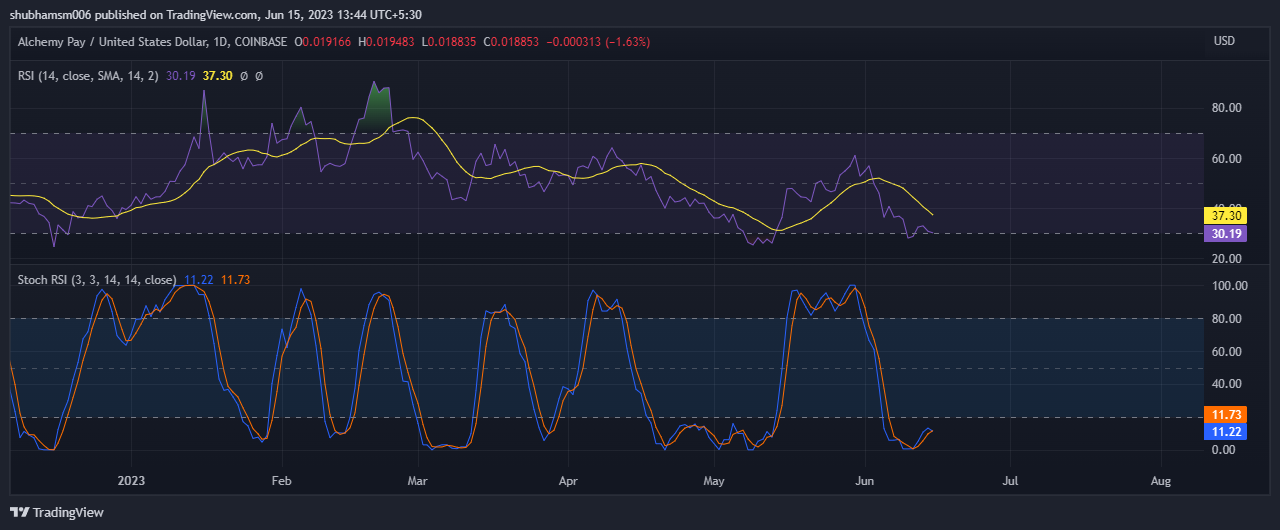
RSI: The current value of RSI is 30.19 points, and the 14 SMA line is below the median line, around 37.30 points which shows bearish sentiment in the market. The 14-day SMA line is below the median as well. It indicates an adverse scenario and bearish sentiment in the current market, as the price is currently at an oversold area.
Stochastic RSI: In the Stochastic RSI, the %d line is 11.73, and the %k line is 11.22 points. The %d line indicates that RSI is heading toward the overbought zone. On the other hand, the %k line shows neutral sentiments regarding the price.
Volume Analysis: Alchemy’s (ACH) trading volume of 24 hours is $13073380, with a rise in the volume of 5.40% which indicates an increase in market activity.
Technical levels
- Support – The current support level of Alchemy (ACH) is $0.016.
- Resistance –The current Resistance level of the Alchemy (ACH) is $0.034.
Conclusion
Alchemy price is in an adverse scenario currently, keeping all the given factors in mind. Indicators like EMA, RSI, MACD, and Stochastic RSI give negative signals about the ACH coin. Investors also not showing any significant buying interest due to the worst performance of the coin. The buyers are not taking substantial buying interest because of bad sentiments in the market and the underperformance of the coins.
Disclaimer
The above analysis is provided for informational purposes only and should not be considered financial, Investment, or other trading advice. Investing in or trading Crypto assets comes with a risk of financial loss. Please consider your circumstances and risk profile before making any investment decisions.