

Near Coin Price Forecast: Will NEAR make a Comeback With Alibaba?
- What is Near’s partnership with Alibaba?
- The price jumped off a strong support point.
- If the price bounces back from the support level, buying action will be seen as the resistance level is nearby.
The Near Foundation’s collaboration with Alibaba Cloud is a significant development for the spread of Web3 technology. Through this partnership, Near protocol will have the opportunity to tap into Alibaba Cloud’s extensive developer ecosystem in Asia and the Middle East. This strategic alliance is expected to enable Near to attract more developers and foster the growth of applications built on the Near protocol.
NEAR’s Previous Price Action a
A year ago, the coin’s price was $3.56, and during a short-term bull run, it surged by about 60% to reach $6.08. However, the rapid ascent was met with strong rejection, causing the price to drop to an average of $4.17 by the end of the month. These movements were accompanied by significant trading volume, reaching as high as $360 million.
In September of the same year, the coin experienced a high at $5.27 but then began a downtrend. Despite having various weak supports, the price kept breaking them, especially after the FTX crash, which favored the bears. News and market fears further contributed to the downward pressure, leading to the coin finally finding a strong support level at $1.24 in late December.
Following this support, a short-term reversal occurred as the coin celebrated the new year. However, the price once again declined, and in March, it attempted to recover twice before the support levels were eventually broken.
Current Price Action and Prediction
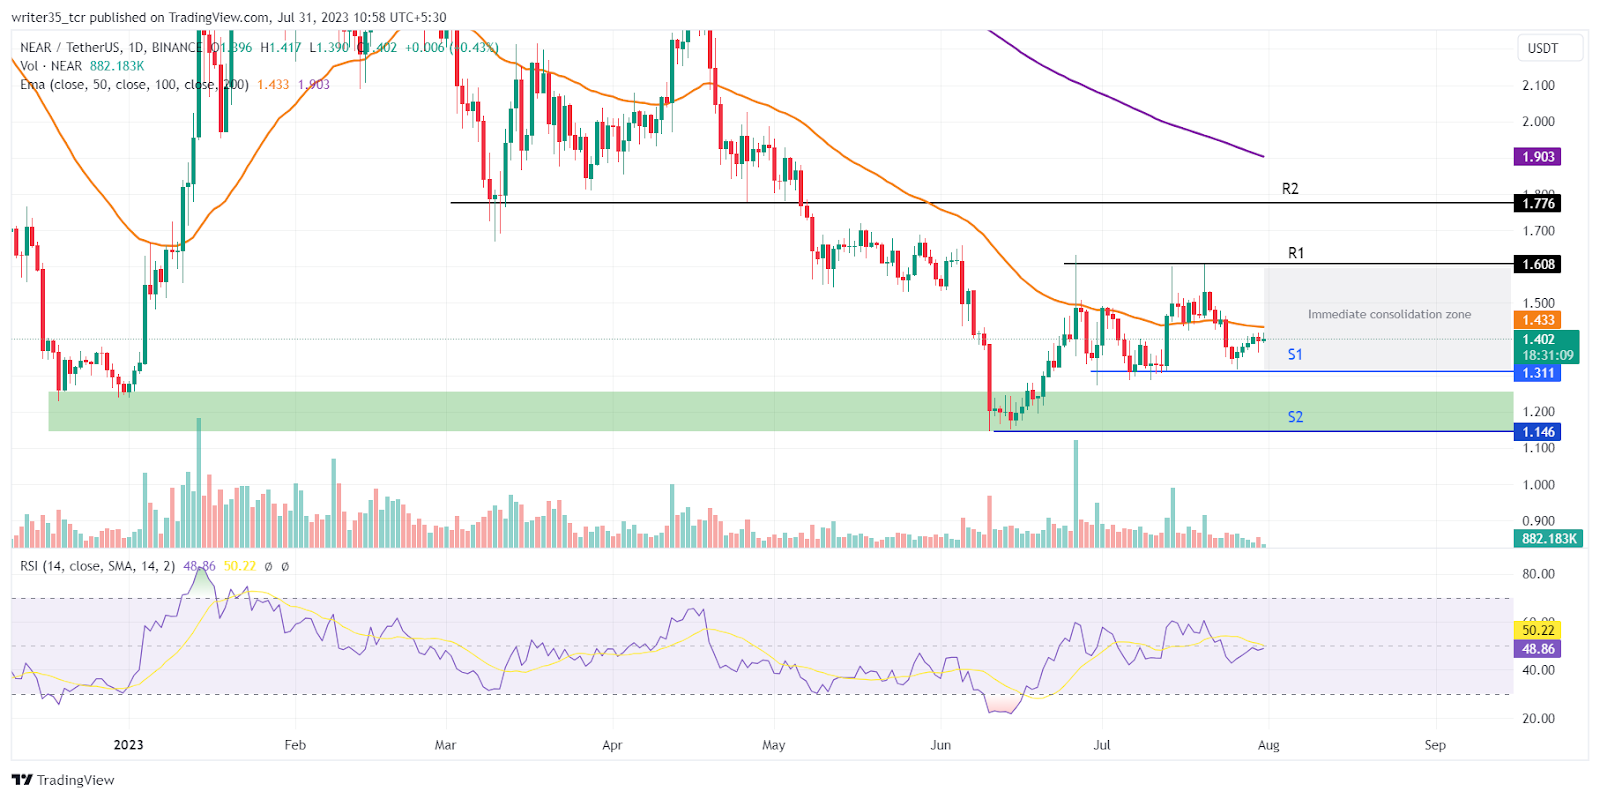
Currently, the coin is exhibiting a consolidation phase with an immediate support at $1.31 and an immediate resistance at $1.61. Notably, a strong support level was formed at $1.24 during the last days of December, and in June, the price rebounded from this same support, establishing it as Support 2. Additionally, a Resistance 2 is being formed around the level of $1.78, which was previously a broken support.
Looking at the Daily Moving Averages, the 50-day moving average (DMA) is at $1.43, very close to the current price, while the 200 DMA stands at $1.903, indicating a medium to long-term downtrend.
The Relative Strength Index (RSI) is currently at 48, suggesting a period of deep consolidation. Until one of the support or resistance levels is breached, the price is likely to remain in the immediate consolidation zone as depicted in the graph.
Conclusion
A year ago, the price of the coin experienced significant volatility as both bulls and bears were actively participating in the market, leading to high trading volume levels. The price action during that period was likely characterized by intense fluctuations and uncertainty.
Currently, the price is consolidating, indicating a phase of relative stability and indecision in the market. The 200-day moving average (DMA) is suggesting a downtrend, signifying that the overall trend has been heading downward over a longer period.
The Relative Strength Index (RSI) is indicating a consolidation phase, which means that the market is neither strongly overbought nor oversold at the moment.
Technical levels
Support : $1.311, $1.146
Resistance : $1.611, $1.776
RSI : 48